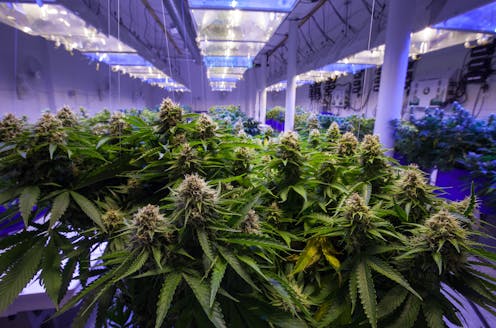
How can we measure the size of Australia’s illegal cannabis market – and the billions in taxes that might flow from legalising it?
- Written by The Conversation

At the end of this month, a senate inquiry by the Legal and Constitutional Affairs Legislation Committee is due to hand down its report on a bill to legalise cannabis.
Legalisation aims to redirect profits away from organised crime, safeguard people aged under 18, and protect public health through strict safety and quality regulations. To achieve these goals, the newly legalised market would need to draw current cannabis consumers – particularly those who use large amounts – away from the illegal market and its established network of suppliers.
A legal market can also be taxed, and the revenues generated could help fund much-needed public spending – for example, on mental health and substance use treatment services. Australia’s Parliamentary Budget Office (PBO) estimates a legalised market would deliver a $28 billion windfall for the public purse in the first decade.
But we think the PBO’s estimate is too high, and based on the current patterns of cannabis use, $13 billion is a more credible estimate.
So how do we know how big the cannabis market is, and how much revenue it could deliver?
How much cannabis do Australians consume?
Assessing the size of an illegal market is – by its very nature – hard. Criminal enterprises do not lodge tax returns or collect GST, and cash transactions leave no digital trace.
However, there are two key ways we can try to estimate it:
- a supply-side approach, which looks at production
- a demand-side approach, which looks at consumption.
Most countries, including Australia, collect survey data on cannabis use, which lends itself best to a demand-side approach.
We can estimate the size of the market – in total annual consumption – by multiplying the number of expected users by the amount they use. But frequent users of cannabis consume very differently to infrequent users, so our approach is to estimate the consumption of different user types separately and then add them up.
The National Drug Strategy Household Survey (NDSHS) collects data on the kinds of illicit drugs Australians are using, and how often.
To estimate the number of users of different types, we take the percentage of Australians who reported a particular frequency of use in the latest National Drug Strategy Household Survey and multiply it by the total number of Australians aged over 14 – the population sampled for the survey.
This is in contrast to the Australian Parliamentary Budget Office, which used data from a survey of Canadians aged over 15 and the size of the Australian adult population. But these particular differences don’t turn out to matter much in practice.
We then adjust for the expected rate of under-reporting in the survey and an anticipated 15% growth in demand due to legalisation.
All up, we estimate that a new legalised market could attract 3.4 million cannabis users in its first year.
Next, we need to calculate the amount of cannabis each of the user types consumes in a year.
We can do this by multiplying the annual number of “use days” by the amount consumed on each use day. For example, daily users have 365 use days per year, whereas for those who use once or twice a year, we use a value of 1.5.
This is where our approach differs from that of the Parliamentary Budget Office, which multiplied the amount consumed on each use day by seven, to obtain weekly use, and then by 52 to get annual use, for all user types.
Did you spot the problem? By multiplying the use day amount by seven and then 52, all users are assumed to use 364 days a year, even if they only use once or twice a year!
The amount consumed on a use day is itself difficult to estimate because the National Drug Strategy Household Survey does not collect information in grams, but rather the number of cones, bongs or joints.
To solve this problem, the Parliamentary Budget Office followed the approach of its Canadian equivalent and used survey data from US think tank RAND, which presented survey respondents with images of different quantities of cannabis to help them estimate their personal use accurately. We also follow this approach.
As can be seen in the above chart, more frequent users consume more on a typical use day. Over the course of a year, a daily user consumes 36 times as much as someone who uses one to three times per month.
The last step is to multiply the number of users by the amount used for each user type. We estimate that Australia consumes 441 tonnes of cannabis per year.
Averaged across the 3.4 million users, this is around 2.5 grams each per week.
The Parliamentary Budget Office’s estimate is much bigger – 6 grams per week – because it assumes all users use 364 days per year.
It’s important to point out that our figure of 441 tonnes per year is based on a number of estimates. Our statistical method means we can only be reasonably certain that it is between 243 and 633 tonnes per year.
But the above chart also tells us a lot about the market’s composition. Together, daily and weekly users account for 98% of consumption even though they account for just 36% of cannabis users. To reduce illegal trade, a new legal market must attract these users.
Can a legal cannabis market work?
In other jurisdictions around the world, frequent users have been attracted to the legal market by high-quality, contaminant-free and THC-labelled cannabis. Leakage to and from the illegal market has also been reduced by seed-to-sale systems that track where cannabis is grown, processed and sold.
But pricing is one of the most important factors. The Parliamentary Budget Office supposes a price of $16.95 per gram, of which $3.55 would be tax – 10% GST and 15% excise. How does this compare to the illegal market?
The Australian Criminal Intelligence Commission (ACIC) estimates that one gram typically costs $22.50. So at first glance a legalised price of $17 seems competitive, especially given the quality guarantee.
But the daily and weekly users typically don’t purchase by the gram. They are much more likely to purchase by the ounce – 28 grams. ACIC estimates put the price of an ounce at $300, which works out at around $11 per gram. This means switching to legal cannabis might not appeal on price to most of the current market.
For this reason, we base our estimated tax revenues on a retail price of $12 per gram, of which $2.51 would be tax.
At this price, and using our market size estimate of 441 tonnes, our ballpark figure for the tax revenue generated in the first ten years of legalisation is around $13 billion. This of course assumes that leakage to and from the illegal market is reduced by a seed-to-sale tracking system.
Policymakers should therefore think carefully about pricing, taxation and providing discounts for buying in bulk. Implementing seed-to-sale monitoring systems could also help protect the legal market.
Otherwise, legalisation might not deny profits to organised crime – or deliver a substantial tax windfall – after all.


